Calculators

Subscriber Risk Map

A dashboard that lets creators calculate subscriber churn probability by entering engagement metrics and comparing retention strategies side by side.

App typeCalculators
AddedMay 16, 2026
Views3 views
Addresssubscriber-engagement-risk-map.hub2.day
Screenshot of Subscriber Risk Map interface showing the project page in use

How it helps

Use it for a focused task

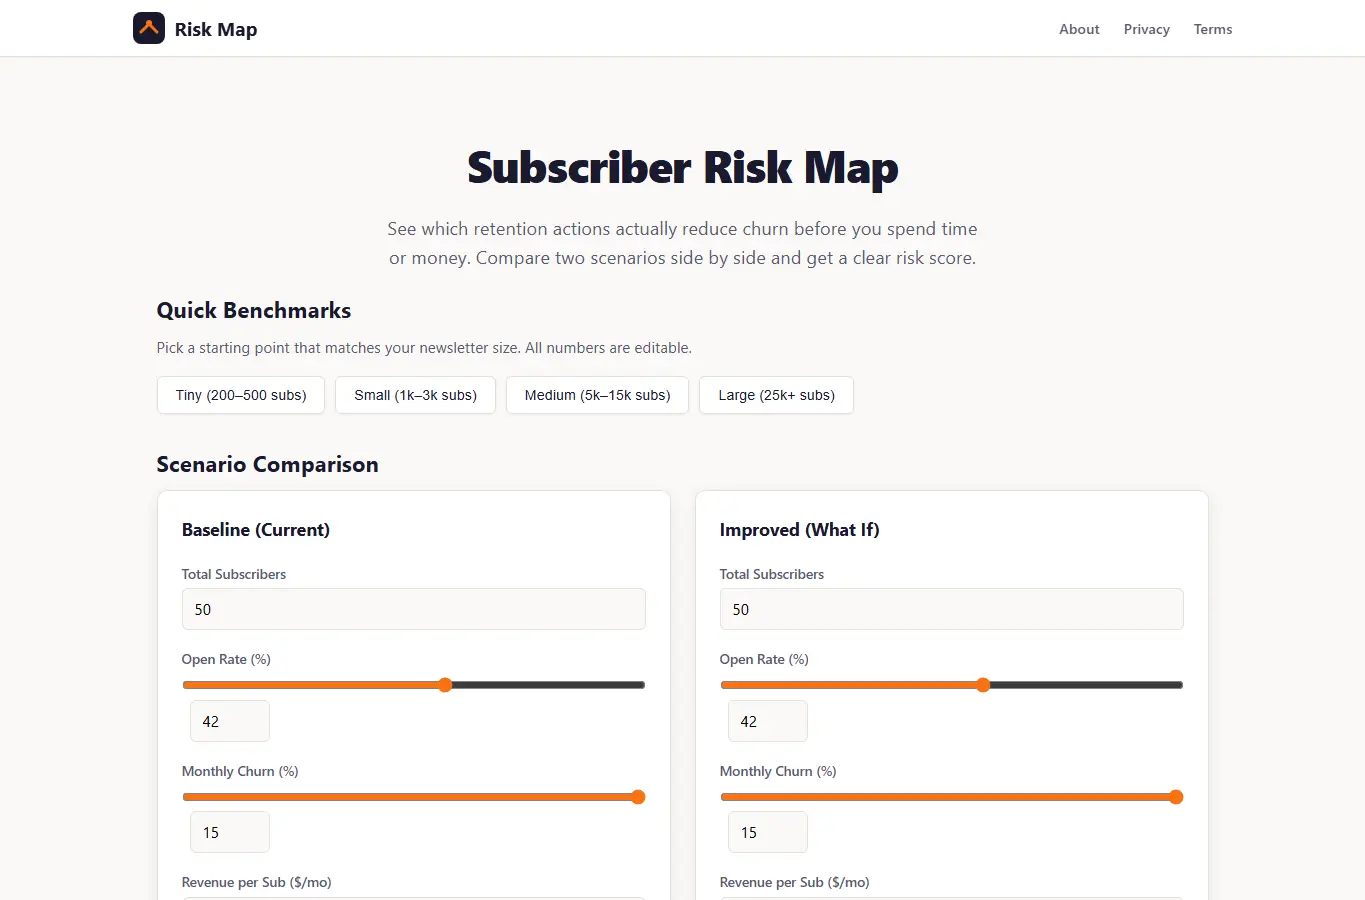
The Subscriber Risk Map helps newsletter creators and subscription businesses see which retention actions move the needle. Instead of guessing, you can model two scenarios side by side, adjust open rates, churn rates, and list size, and get a risk score plus a projected subscriber count after 12 months.

Start with the preset benchmarks that match your newsletter size. Adjust the sliders or type numbers directly for your current baseline.

Then tweak the improvement scenario to see what happens if you raise open rates or lower churn. The risk gauge updates live, and the comparison table shows the dollar impact if you have a revenue per subscriber estimate.

Good next steps

Make the result easier to act on

  • Start with the examples or presets if you are unsure what to enter for Subscriber Risk Map.
  • Try one realistic scenario first, then adjust the numbers or notes to compare another path.
  • Use save or share from the project footer when you want to return to the same helper later.
  • Open a related project below when the result points to a timing, budget, writing, planning, or comparison task.

Topics

Where this fits

Related projects