Utilities

PollenGate: Allergy Window Tracker

Track your daily allergy symptoms against local pollen counts to identify your personal trigger thresholds.

App typeUtilities
AddedJun 3, 2026
Uses2 uses
Addressseasonal-allergy-window-tracker.hub2.day
Screenshot of PollenGate: Allergy Window Tracker interface showing the project page in use

How it helps

Use it for a focused task

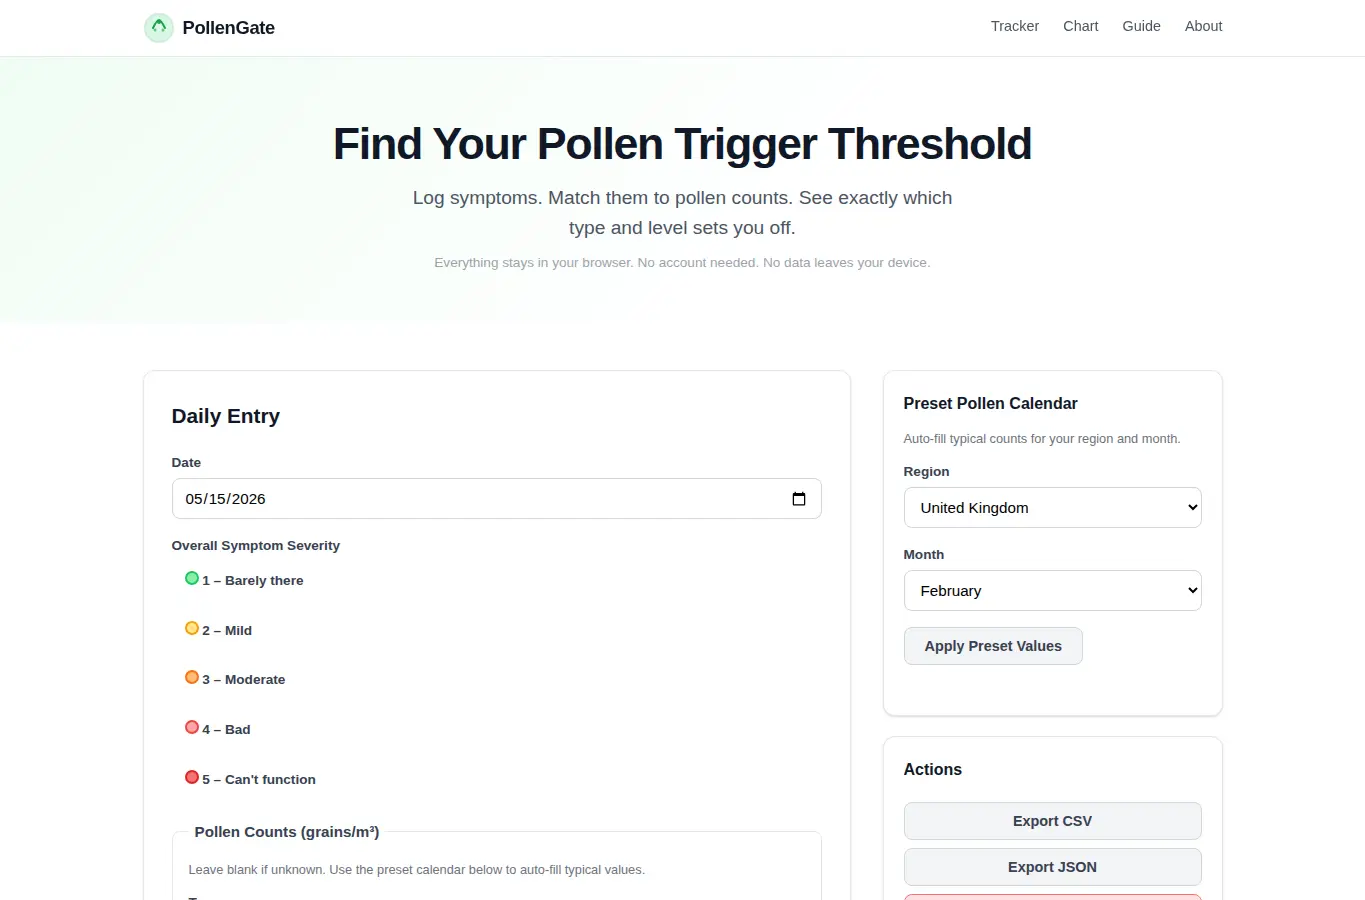
PollenGate helps you connect your daily symptoms to pollen counts so you can spot your personal trigger thresholds. Log each day's symptom severity and pollen exposure, then watch the correlation chart reveal patterns over time.

Data stays in your browser. Nothing is sent to a server.

Each day, pick your overall symptom severity from 1 (barely noticeable) to 5 (can't function). Enter the pollen count for each type (tree, grass, ragweed) if you know it, or use the preset calendar to auto-fill typical values for your region and date.

Good next steps

Make the result easier to act on

  • Start with the examples or presets if you are unsure what to enter for PollenGate: Allergy Window Tracker.
  • Try one realistic scenario first, then adjust the numbers or notes to compare another path.
  • Use save or share from the project footer when you want to return to the same helper later.
  • Open a related project below when the result points to a timing, budget, writing, planning, or comparison task.

Topics

Where this fits

Related projects