
How it helps
Use it for a focused task
The mapper helps you visualize where your pet experiences stress or excitement in your home. Draw your floor plan as a grid, mark appliances, and log behaviors to see sensitivity patterns emerge.
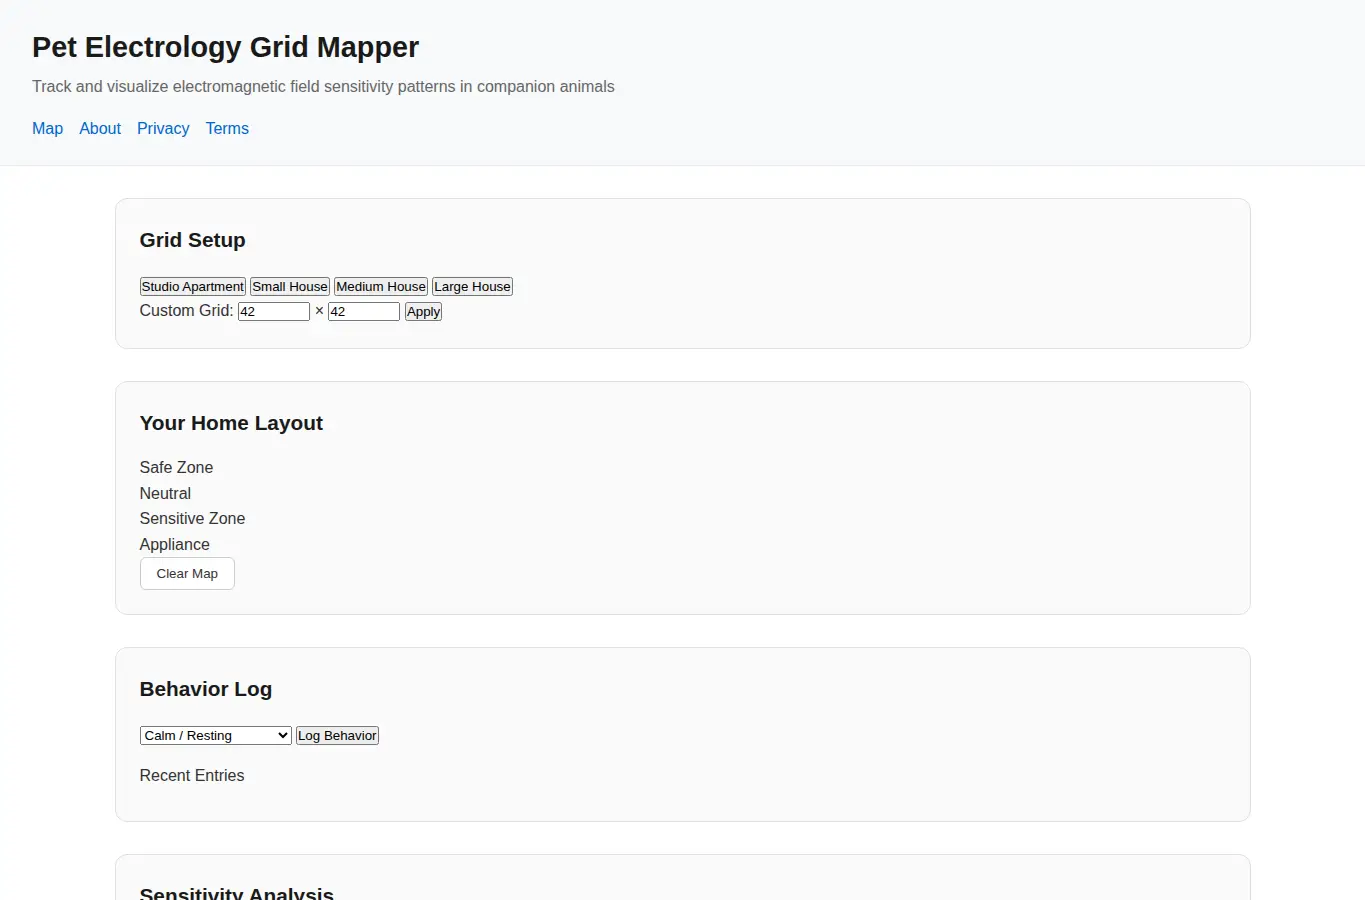
Start by setting your grid dimensions using the presets or entering custom width and height. Click cells to place appliances (fridge, microwave, etc.).
Use the behavior log to record what your pet does at each location. The heatmap updates automatically showing red for sensitive areas and green for comfortable zones.