
How it helps
Use it for a focused task
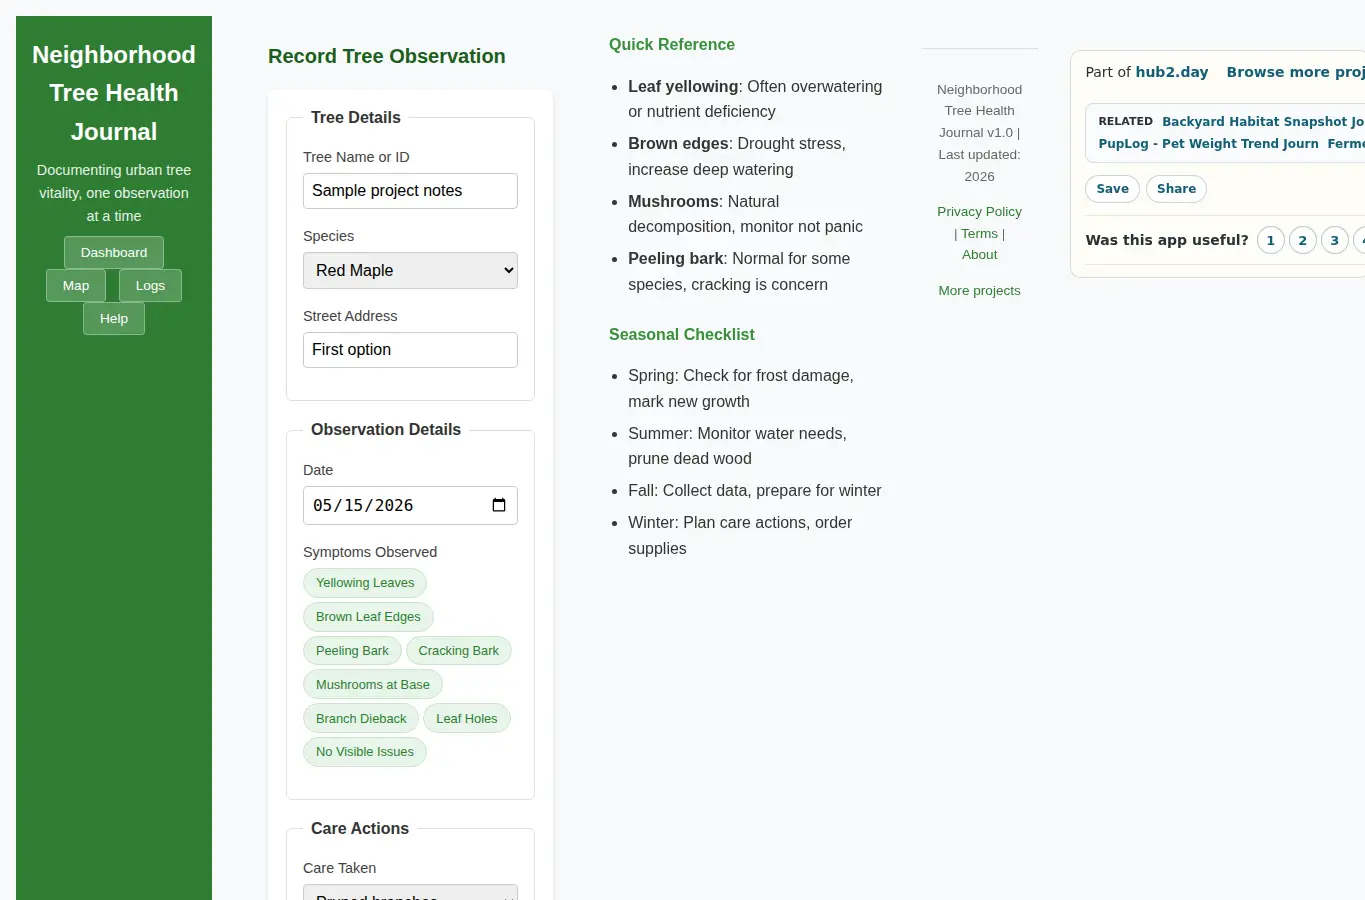
The journal helps you map trees on your block, log symptoms like leaf discoloration or bark damage, and track care actions with photo evidence. Each entry creates a timeline that shows how your trees change through the seasons.
Click 'Add Tree' to place a marker on your street, then use 'New Entry' to record observations. Add photos, select symptoms from the preset list, and note any care actions taken.
The dashboard shows your entries over time with simple charts. Cities need granular data on tree vitality.