
Guides

Neighborhood Sustainability Dashboard

A community progress tracker that visualizes local environmental actions like car-free days, recycling rates, and renewable energy adoption

App typeGuides
AddedJul 8, 2026
Uses2 uses
Addressneighborhood-sustainability-dashboard.hub2.day
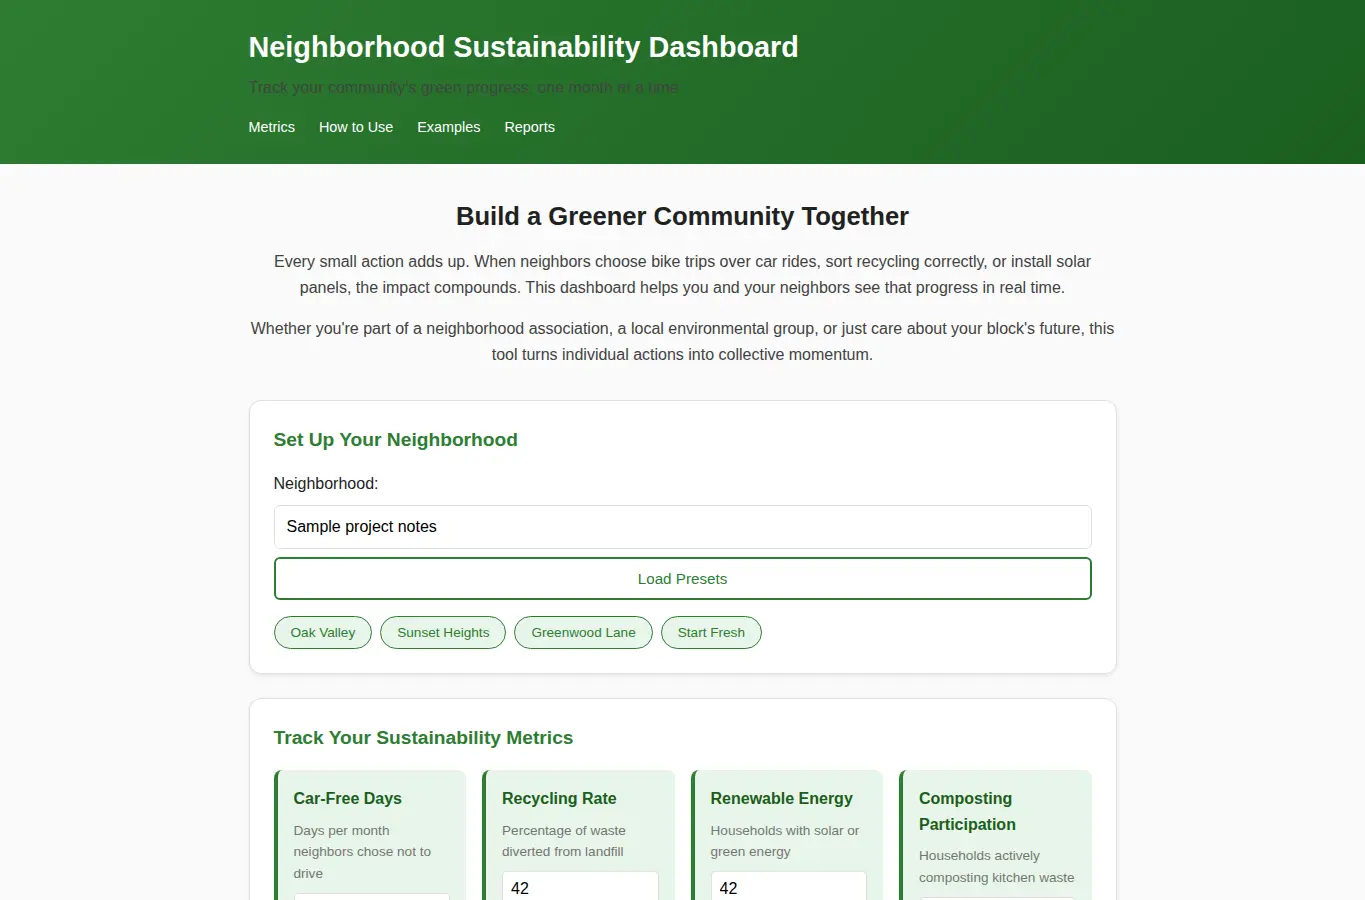
Screenshot of Neighborhood Sustainability Dashboard interface showing the project page in use

How it helps

Use it for a focused task

Enter monthly data for your neighborhood's sustainability actions across five key metrics. The dashboard generates trend lines showing progress over time, celebrates milestone achievements, and creates shareable community reports.

Use the presets for common metrics or add custom categories specific to your neighborhood's initiatives. Start by selecting your neighborhood from the preset list or adding a custom name.

Enter monthly data points for each metric category. The dashboard updates automatically showing current trends.

Good next steps

Make the result easier to act on

  • Start with the examples or presets if you are unsure what to enter for Neighborhood Sustainability Dashboard.
  • Try one realistic scenario first, then adjust the numbers or notes to compare another path.
  • Use save or share from the project footer when you want to return to the same helper later.
  • Open a related project below when the result points to a timing, budget, writing, planning, or comparison task.

Topics

Where this fits

Related projects