
How it helps
Use it for a focused task
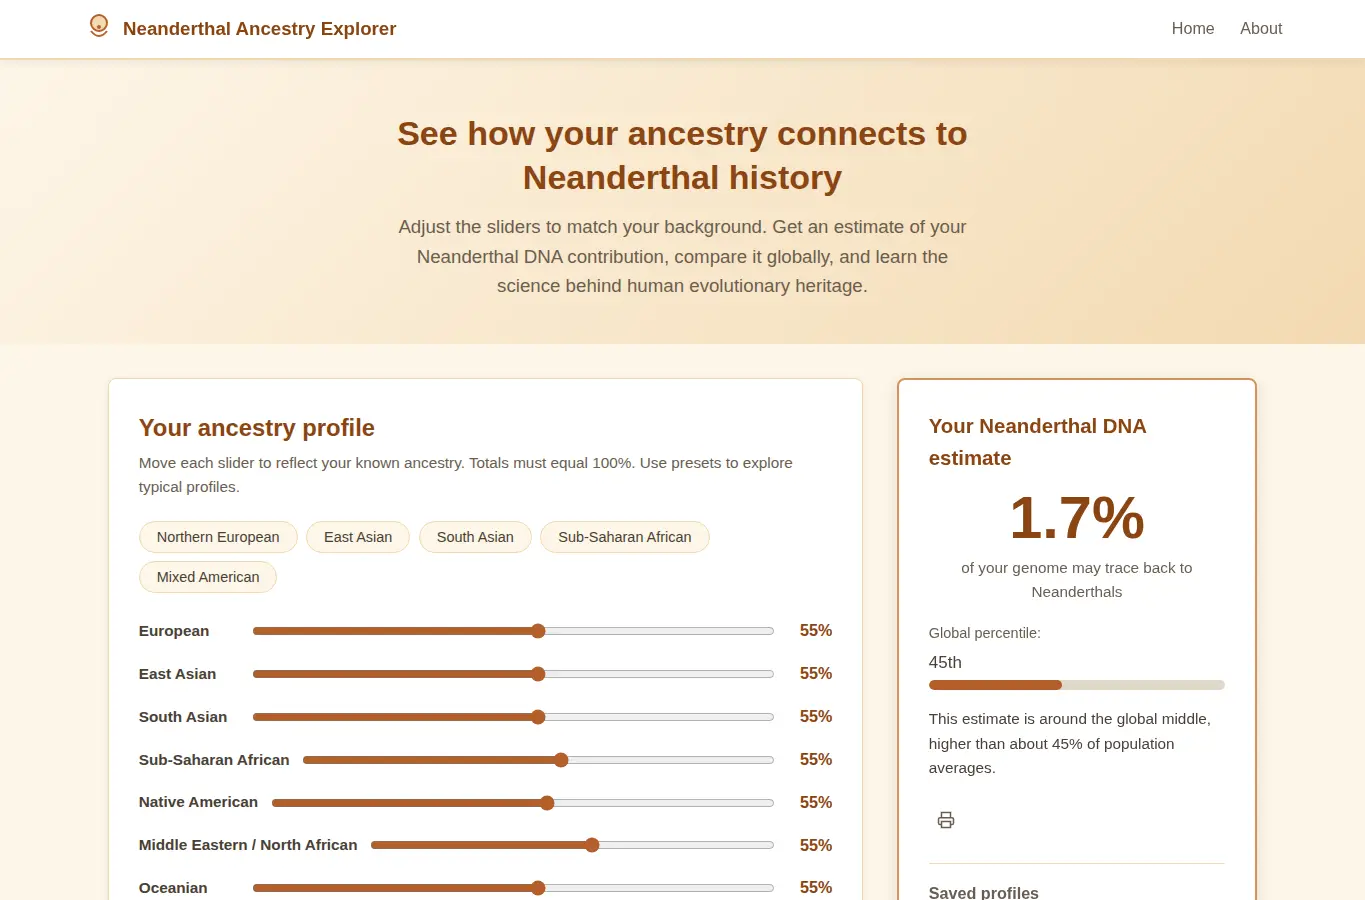
This explorer helps you understand what your reported ancestry percentages might mean for Neanderthal DNA inheritance. You adjust sliders for different ancestry regions, see an estimated Neanderthal contribution, and compare it to global averages.
A timeline shows when Neanderthals lived and when interbreeding happened. A comparison table lets you see how your estimate stacks up against typical results from different parts of the world.
The science notes explain the key studies, what the numbers actually measure, and common mistakes people make when reading ancestry reports. Move the sliders to match your known ancestry composition.